Create a cross-section of geopotiential height for a specific region
Uses iris to open raw UM model data - predates automatic netCDF conversion in the AUS2200 suite. Useful for diagnosing model instabilities.
[1]:
import xarray as xr
import datetime
import cartopy.crs as ccrs
from matplotlib import pyplot as plt, animation
from glob import glob
import iris
[2]:
ts1=30
starttime=datetime.datetime(year=2022,month=2,day=21,hour=18)
td1=datetime.timedelta(seconds=ts1)

ts2=75
td2=datetime.timedelta(seconds=ts2)

tdg=datetime.timedelta(seconds=15)
[3]:
ds=xr.open_dataset(f"/g/data/hh5/tmp/WACI-Hackathon-2023/AUS2200/data/surf/1hr/orog_1hr_{(starttime + datetime.timedelta(hours=7)).strftime('%Y%m%d')}_20220307.nc")
[4]:
x_min=min(ds.longitude)
x_max=max(ds.longitude)
y_min=min(ds.latitude)
y_max=max(ds.latitude)
ex=(x_min,x_max,y_min,y_max)
x_minf=x_min.data.item()
x_maxf=x_max.data.item()
y_minf=y_min.data.item()
y_maxf=y_max.data.item()
[5]:
ds
[5]:
<xarray.Dataset>
Dimensions:    (latitude: 2120, longitude: 2600, time: 336)
Coordinates:
  * latitude   (latitude) float32 -48.79 -48.77 -48.75 ... -6.871 -6.852 -6.832
  * longitude  (longitude) float32 107.5 107.5 107.6 107.6 ... 158.9 159.0 159.0
  * time       (time) datetime64[ns] 2022-02-22T00:00:30 ... 2022-03-08
Data variables:
    orog       (time, latitude, longitude) float32 ...
Attributes: (12/25)
    Conventions:          CF-1.6, ACDD-1.3
    title:                AUS2200 UM amip simulation over Australian region f...
    summary:              A limited area model study of the entire Australian...
    source:               UM v12.2 ECMWF ERA5 forecast fields used as forcings
    license:              http://creativecommons.org/licenses/by/4.0/
    product_version:      0.1
    ...                   ...
    geospatial_lon_min:   107.5101
    geospatial_lon_max:   0.0198
    contributor_name:     Sam Green, Paola Petrelli
    contributor_email:    sam.green@unsw.edu.au, paola.petrelli@utas.edu.au
    contributor_url:      https://orcid.org/0000-0003-1129-4676, https://orci...
contributor_role: post-processing, post-processing[6]:
xr.where(ds.orog[0] < -10,True,False).sum()
[6]:
<xarray.DataArray 'orog' ()>
array(2)
Coordinates:
time datetime64[ns] 2022-02-22T00:00:30[7]:
fig, ax1 = plt.subplots()
[8]:
ds.orog[0].sel(latitude=-6.851597,longitude=slice(143.1,143.5)).plot(ax=ax1)
[8]:
[<matplotlib.lines.Line2D at 0x146b29188a60>]
[9]:
cubes=iris.load("/scratch/w40/dr4292/aus2200-instability-analysis/30sec/20220222T0000Z/aus2200/d0198/RA3/um/umnsa_mdl_20220222T0000")
/g/data/hh5/public/apps/cms_conda/envs/analysis3-23.01/lib/python3.9/site-packages/iris/fileformats/rules.py:353: UserWarning: Unable to create instance of HybridHeightFactory. The source data contains no field(s) for 'orography'.
  warnings.warn(msg.format(factory=factory_name))
[10]:
cubes
[10]:
| M01S03I468 (unknown) | model_level_number | latitude | longitude |
|---|---|---|---|
| Shape | 45 | 2120 | 2600 |
| Dimension coordinates | |||
| model_level_number | x | - | - |
| latitude | - | x | - |
| longitude | - | - | x |
| Auxiliary coordinates | |||
| level_height | x | - | - |
| sigma | x | - | - |
| Scalar coordinates | |||
| forecast_period | 13.0 hours | ||
| forecast_reference_time | 2022-02-21 12:00:00 | ||
| time | 2022-02-22 01:00:00 | ||
| Attributes | |||
| STASH | m01s03i468 | ||
| source | 'Data from Met Office Unified Model' | ||
| um_version | '12.2' | ||
| M01S03I473 (unknown) | model_level_number | latitude | longitude |
|---|---|---|---|
| Shape | 45 | 2120 | 2600 |
| Dimension coordinates | |||
| model_level_number | x | - | - |
| latitude | - | x | - |
| longitude | - | - | x |
| Auxiliary coordinates | |||
| level_height | x | - | - |
| sigma | x | - | - |
| Scalar coordinates | |||
| forecast_period | 13.0 hours | ||
| forecast_reference_time | 2022-02-21 12:00:00 | ||
| time | 2022-02-22 01:00:00 | ||
| Attributes | |||
| STASH | m01s03i473 | ||
| source | 'Data from Met Office Unified Model' | ||
| um_version | '12.2' | ||
| Air Potential Temperature (K) | model_level_number | latitude | longitude |
|---|---|---|---|
| Shape | 70 | 2120 | 2600 |
| Dimension coordinates | |||
| model_level_number | x | - | - |
| latitude | - | x | - |
| longitude | - | - | x |
| Auxiliary coordinates | |||
| level_height | x | - | - |
| sigma | x | - | - |
| Scalar coordinates | |||
| forecast_period | 13.0 hours | ||
| forecast_reference_time | 2022-02-21 12:00:00 | ||
| time | 2022-02-22 01:00:00 | ||
| Attributes | |||
| STASH | m01s00i004 | ||
| source | 'Data from Met Office Unified Model' | ||
| um_version | '12.2' | ||
| Air Pressure (Pa) | model_level_number | latitude | longitude |
|---|---|---|---|
| Shape | 71 | 2120 | 2600 |
| Dimension coordinates | |||
| model_level_number | x | - | - |
| latitude | - | x | - |
| longitude | - | - | x |
| Auxiliary coordinates | |||
| level_height | x | - | - |
| sigma | x | - | - |
| Scalar coordinates | |||
| forecast_period | 13.0 hours | ||
| forecast_reference_time | 2022-02-21 12:00:00 | ||
| time | 2022-02-22 01:00:00 | ||
| Attributes | |||
| STASH | m01s00i407 | ||
| source | 'Data from Met Office Unified Model' | ||
| um_version | '12.2' | ||
| Air Pressure (Pa) | model_level_number | latitude | longitude |
|---|---|---|---|
| Shape | 70 | 2120 | 2600 |
| Dimension coordinates | |||
| model_level_number | x | - | - |
| latitude | - | x | - |
| longitude | - | - | x |
| Auxiliary coordinates | |||
| level_height | x | - | - |
| sigma | x | - | - |
| Scalar coordinates | |||
| forecast_period | 13.0 hours | ||
| forecast_reference_time | 2022-02-21 12:00:00 | ||
| time | 2022-02-22 01:00:00 | ||
| Attributes | |||
| STASH | m01s00i408 | ||
| source | 'Data from Met Office Unified Model' | ||
| um_version | '12.2' | ||
| Air Temperature (K) | model_level_number | latitude | longitude |
|---|---|---|---|
| Shape | 70 | 2120 | 2600 |
| Dimension coordinates | |||
| model_level_number | x | - | - |
| latitude | - | x | - |
| longitude | - | - | x |
| Auxiliary coordinates | |||
| level_height | x | - | - |
| sigma | x | - | - |
| Scalar coordinates | |||
| forecast_period | 13.0 hours | ||
| forecast_reference_time | 2022-02-21 12:00:00 | ||
| time | 2022-02-22 01:00:00 | ||
| Attributes | |||
| STASH | m01s16i004 | ||
| source | 'Data from Met Office Unified Model' | ||
| um_version | '12.2' | ||
| Height Above Reference Ellipsoid (m) | model_level_number | latitude | longitude |
|---|---|---|---|
| Shape | 70 | 2120 | 2600 |
| Dimension coordinates | |||
| model_level_number | x | - | - |
| latitude | - | x | - |
| longitude | - | - | x |
| Auxiliary coordinates | |||
| level_height | x | - | - |
| sigma | x | - | - |
| Scalar coordinates | |||
| forecast_period | 12.008333333360497 hours | ||
| forecast_reference_time | 2022-02-21 12:00:00 | ||
| time | 2022-02-22 00:00:30 | ||
| Attributes | |||
| STASH | m01s15i101 | ||
| source | 'Data from Met Office Unified Model' | ||
| um_version | '12.2' | ||
| Height Above Reference Ellipsoid (m) | model_level_number | latitude | longitude |
|---|---|---|---|
| Shape | 70 | 2120 | 2600 |
| Dimension coordinates | |||
| model_level_number | x | - | - |
| latitude | - | x | - |
| longitude | - | - | x |
| Auxiliary coordinates | |||
| level_height | x | - | - |
| sigma | x | - | - |
| Scalar coordinates | |||
| forecast_period | 12.008333333360497 hours | ||
| forecast_reference_time | 2022-02-21 12:00:00 | ||
| time | 2022-02-22 00:00:30 | ||
| Attributes | |||
| STASH | m01s15i102 | ||
| source | 'Data from Met Office Unified Model' | ||
| um_version | '12.2' | ||
| Specific Humidity (kg kg-1) | model_level_number | latitude | longitude |
|---|---|---|---|
| Shape | 70 | 2120 | 2600 |
| Dimension coordinates | |||
| model_level_number | x | - | - |
| latitude | - | x | - |
| longitude | - | - | x |
| Auxiliary coordinates | |||
| level_height | x | - | - |
| sigma | x | - | - |
| Scalar coordinates | |||
| forecast_period | 13.0 hours | ||
| forecast_reference_time | 2022-02-21 12:00:00 | ||
| time | 2022-02-22 01:00:00 | ||
| Attributes | |||
| STASH | m01s00i010 | ||
| source | 'Data from Met Office Unified Model' | ||
| um_version | '12.2' | ||
| Upward Air Velocity (m s-1) | model_level_number | latitude | longitude |
|---|---|---|---|
| Shape | 70 | 2120 | 2600 |
| Dimension coordinates | |||
| model_level_number | x | - | - |
| latitude | - | x | - |
| longitude | - | - | x |
| Auxiliary coordinates | |||
| level_height | x | - | - |
| sigma | x | - | - |
| Scalar coordinates | |||
| forecast_period | 13.0 hours | ||
| forecast_reference_time | 2022-02-21 12:00:00 | ||
| time | 2022-02-22 01:00:00 | ||
| Attributes | |||
| STASH | m01s00i150 | ||
| source | 'Data from Met Office Unified Model' | ||
| um_version | '12.2' | ||
| X Wind (m s-1) | model_level_number | latitude | longitude |
|---|---|---|---|
| Shape | 70 | 2120 | 2600 |
| Dimension coordinates | |||
| model_level_number | x | - | - |
| latitude | - | x | - |
| longitude | - | - | x |
| Auxiliary coordinates | |||
| level_height | x | - | - |
| sigma | x | - | - |
| Scalar coordinates | |||
| forecast_period | 13.0 hours | ||
| forecast_reference_time | 2022-02-21 12:00:00 | ||
| time | 2022-02-22 01:00:00 | ||
| Attributes | |||
| STASH | m01s00i002 | ||
| source | 'Data from Met Office Unified Model' | ||
| um_version | '12.2' | ||
| Y Wind (m s-1) | model_level_number | latitude | longitude |
|---|---|---|---|
| Shape | 70 | 2121 | 2600 |
| Dimension coordinates | |||
| model_level_number | x | - | - |
| latitude | - | x | - |
| longitude | - | - | x |
| Auxiliary coordinates | |||
| level_height | x | - | - |
| sigma | x | - | - |
| Scalar coordinates | |||
| forecast_period | 13.0 hours | ||
| forecast_reference_time | 2022-02-21 12:00:00 | ||
| time | 2022-02-22 01:00:00 | ||
| Attributes | |||
| STASH | m01s00i003 | ||
| source | 'Data from Met Office Unified Model' | ||
| um_version | '12.2' | ||
[11]:
theta_da=xr.DataArray.from_iris(cubes[6]).chunk({"model_level_number":-1,"latitude":106,"longitude":130})
[12]:
#small_da=theta_da.sel(latitude=-6.851597,longitude=slice(143.1,143.5))
small_da=theta_da.sel(latitude=-6.851597,method='nearest').sel(longitude=slice(143.09,143.5))
[13]:
small_da
[13]:
<xarray.DataArray 'height_above_reference_ellipsoid' (model_level_number: 70,
                                                      longitude: 21)>
dask.array<getitem, shape=(70, 21), dtype=float64, chunksize=(70, 21), chunktype=numpy.ndarray>
Coordinates:
  * model_level_number       (model_level_number) int64 1 2 3 4 ... 67 68 69 70
    latitude                 float32 -6.852
  * longitude                (longitude) float32 143.1 143.1 ... 143.5 143.5
    forecast_period          timedelta64[ns] ...
    forecast_reference_time  datetime64[ns] ...
    time                     datetime64[ns] ...
    level_height             (model_level_number) float64 dask.array<chunksize=(70,), meta=np.ndarray>
    sigma                    (model_level_number) float64 dask.array<chunksize=(70,), meta=np.ndarray>
Attributes:
    standard_name:  height_above_reference_ellipsoid
    units:          m
    source:         Data from Met Office Unified Model
    um_version:     12.2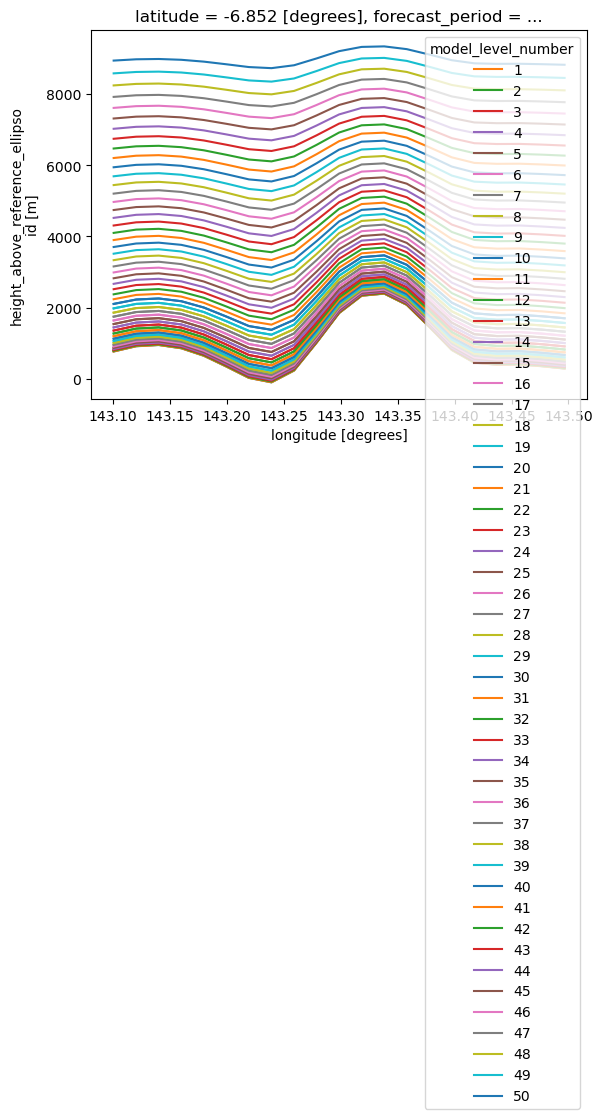
STASH: m01s15i101[16]:
small_da[:50].plot.line(hue="model_level_number",ax=ax1)
[16]:
[<matplotlib.lines.Line2D at 0x146b312281f0>,
 <matplotlib.lines.Line2D at 0x146b312c90d0>,
 <matplotlib.lines.Line2D at 0x146b2857cf40>,
 <matplotlib.lines.Line2D at 0x146b28ae0640>,
 <matplotlib.lines.Line2D at 0x146b28a948b0>,
 <matplotlib.lines.Line2D at 0x146b287dac10>,
 <matplotlib.lines.Line2D at 0x146b287da1f0>,
 <matplotlib.lines.Line2D at 0x146b287dadf0>,
 <matplotlib.lines.Line2D at 0x146b28777430>,
 <matplotlib.lines.Line2D at 0x146b28777190>,
 <matplotlib.lines.Line2D at 0x146b28777220>,
 <matplotlib.lines.Line2D at 0x146b28777340>,
 <matplotlib.lines.Line2D at 0x146b287774c0>,
 <matplotlib.lines.Line2D at 0x146b287776a0>,
 <matplotlib.lines.Line2D at 0x146b28777820>,
 <matplotlib.lines.Line2D at 0x146b287778b0>,
 <matplotlib.lines.Line2D at 0x146b28777e80>,
 <matplotlib.lines.Line2D at 0x146b28777910>,
 <matplotlib.lines.Line2D at 0x146b28777d30>,
 <matplotlib.lines.Line2D at 0x146b28777a00>,
 <matplotlib.lines.Line2D at 0x146b28777b20>,
 <matplotlib.lines.Line2D at 0x146b2870e190>,
 <matplotlib.lines.Line2D at 0x146b2870e310>,
 <matplotlib.lines.Line2D at 0x146b2870e3d0>,
 <matplotlib.lines.Line2D at 0x146b2870e490>,
 <matplotlib.lines.Line2D at 0x146b2870eaf0>,
 <matplotlib.lines.Line2D at 0x146b2870ec10>,
 <matplotlib.lines.Line2D at 0x146b2870ec70>,
 <matplotlib.lines.Line2D at 0x146b2870ed90>,
 <matplotlib.lines.Line2D at 0x146b2870eee0>,
 <matplotlib.lines.Line2D at 0x146b2870efd0>,
 <matplotlib.lines.Line2D at 0x146b2870e730>,
 <matplotlib.lines.Line2D at 0x146b2870ea60>,
 <matplotlib.lines.Line2D at 0x146b28715070>,
 <matplotlib.lines.Line2D at 0x146b28715100>,
 <matplotlib.lines.Line2D at 0x146b28715340>,
 <matplotlib.lines.Line2D at 0x146b28715eb0>,
 <matplotlib.lines.Line2D at 0x146b28715940>,
 <matplotlib.lines.Line2D at 0x146b28715970>,
 <matplotlib.lines.Line2D at 0x146b28715be0>,
 <matplotlib.lines.Line2D at 0x146b28715b80>,
 <matplotlib.lines.Line2D at 0x146b28715d60>,
 <matplotlib.lines.Line2D at 0x146b28715f70>,
 <matplotlib.lines.Line2D at 0x146b287157f0>,
 <matplotlib.lines.Line2D at 0x146b28715610>,
 <matplotlib.lines.Line2D at 0x146b287240d0>,
 <matplotlib.lines.Line2D at 0x146b28724190>,
 <matplotlib.lines.Line2D at 0x146b287247f0>,
 <matplotlib.lines.Line2D at 0x146b28724910>,
 <matplotlib.lines.Line2D at 0x146b28724970>]
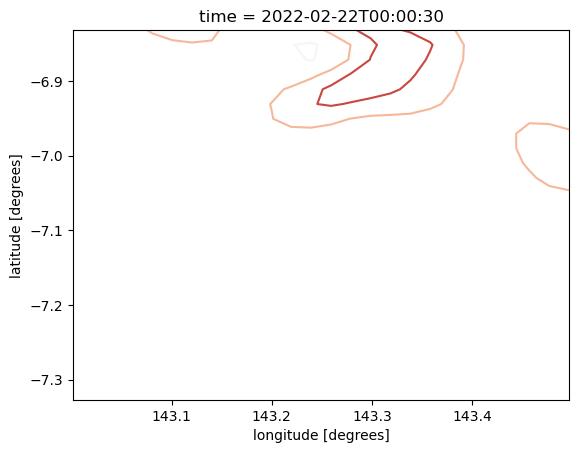
[30]:
ds.orog[0].sel(longitude=slice(143,143.5),latitude=slice(-7.33,-6.83)).plot.contour()
[30]:
<matplotlib.contour.QuadContourSet at 0x1530d24c7250>
[17]:
fig
[17]:
[ ]: