Demo for the AUS2200 intake catalogue
How to load output for an experiment without knowledge where the output lives on NCI
[1]:
import intake
import cf_xarray
[2]:
catalog = intake.open_catalog('/g/data/ua8/Working/packages/aus2200-intake/catalogue.yaml')
List all the datasets available.
[3]:
list(catalog)
[3]:
['ashwed80', 'ashwed83', 'canberra03', 'combined']
At the moment we have one dataset for each separate simulation and a combined dataset which includes all simulations.
Example of dataset for a single simulation: canberra03
[4]:
experiment = catalog['canberra03']
experiment.description
[4]:
'A limited area model study of the entire Australian continent at 2.2 km resolution, using the UM atmospheric model. ERA5+ERA5Land reanalysis data was used to provide initial and boundary conditions. The study covers the time period of 2003-01-16 to 2003-01-19, including the 2003 Canberra bushfires.\nThis dataset is part of the AUS2200 simulations collection at NCI.\n'
What are the available variables?
[5]:
experiment.unique()['variable']
[5]:
['amdry',
 'amwet',
 'clhigh',
 'cllow',
 'clmed',
 'clmxro',
 'hus',
 'huss',
 'nflash',
 'pralsns',
 'pralsprof',
 'ps',
 'psl',
 'reflmax',
 'storm',
 'tas',
 'tdps',
 'ts',
 'uas',
 'vas',
 'wsgmax10m',
 'cl',
 'cli',
 'clw',
 'eow',
 'estot',
 'evspsbl',
 'grplmxrat',
 'hfls',
 'hfss',
 'mrso',
 'mrsol',
 'pfull',
 'phalf',
 'refl',
 'ta',
 'ua',
 'va',
 'wa',
 'rainmxrat',
 'rlds',
 'rls',
 'rlut',
 'rsds',
 'rsdsdiff',
 'rsdsdir',
 'rsdt',
 'rss',
 'rsut',
 'theta',
 'tke',
 'z0',
 'zmla',
 'lmask',
 'orog']
Let’s get one (e.g., the temperature) and do some super-duper analysis!
[6]:
ds = experiment.search(variable='tas', frequency="1hr").to_dask()
ds
[6]:
<xarray.Dataset> Size: 2GB
Dimensions:    (time: 96, bnds: 2, lat: 2120, lon: 2600)
Coordinates:
  * time       (time) datetime64[ns] 768B 2003-01-16T00:29:59.999999872 ... 2...
  * lat        (lat) float64 17kB -48.79 -48.77 -48.75 ... -6.871 -6.852 -6.832
  * lon        (lon) float64 21kB 107.5 107.5 107.6 107.6 ... 158.9 159.0 159.0
    height     float64 8B ...
Dimensions without coordinates: bnds
Data variables:
    time_bnds  (time, bnds) datetime64[ns] 2kB dask.array<chunksize=(1, 2), meta=np.ndarray>
    lat_bnds   (lat, bnds) float64 34kB dask.array<chunksize=(2120, 2), meta=np.ndarray>
    lon_bnds   (lon, bnds) float64 42kB dask.array<chunksize=(2600, 2), meta=np.ndarray>
    tas        (time, lat, lon) float32 2GB dask.array<chunksize=(1, 1060, 1300), meta=np.ndarray>
Attributes: (12/55)
    Conventions:                     CF-1.7 ACDD1.3
    contact:                         dsroberts@unimelb.edu.au
    contributor_email:               paola.petrelli@utas.edu.au, sam.green@un...
    contributor_name:                Paola Petrelli, Samuel Green
    contributor_role:                data_curator, data_curator
    contributor_url:                 https://orcid.org/0000-0002-0164-5105, h...
    ...                              ...
    intake_esm_attrs:variable:       tas
    intake_esm_attrs:experiment_id:  canberra03
    intake_esm_attrs:frequency:      1hr
    intake_esm_attrs:date_range:     200301160030-200301192330
    intake_esm_attrs:_data_format_:  netcdf
    intake_esm_dataset_key:          v1-0.1hr.tas
xarray.Dataset
- time: 96
- bnds: 2
- lat: 2120
- lon: 2600
- time(time)datetime64[ns]2003-01-16T00:29:59.999999872 .....
- bounds :
- time_bnds
- axis :
- T
- long_name :
- time
- standard_name :
- time
array(['2003-01-16T00:29:59.999999872', '2003-01-16T01:30:00.000000000', '2003-01-16T02:30:00.000000128', '2003-01-16T03:29:59.999999872', '2003-01-16T04:30:00.000000000', '2003-01-16T05:30:00.000000128', '2003-01-16T06:29:59.999999872', '2003-01-16T07:30:00.000000000', '2003-01-16T08:30:00.000000128', '2003-01-16T09:29:59.999999872', '2003-01-16T10:30:00.000000000', '2003-01-16T11:30:00.000000128', '2003-01-16T12:29:59.999999872', '2003-01-16T13:30:00.000000000', '2003-01-16T14:30:00.000000128', '2003-01-16T15:29:59.999999872', '2003-01-16T16:30:00.000000000', '2003-01-16T17:30:00.000000128', '2003-01-16T18:29:59.999999872', '2003-01-16T19:30:00.000000000', '2003-01-16T20:30:00.000000128', '2003-01-16T21:29:59.999999872', '2003-01-16T22:30:00.000000000', '2003-01-16T23:30:00.000000128', '2003-01-17T00:29:59.999999872', '2003-01-17T01:30:00.000000000', '2003-01-17T02:30:00.000000128', '2003-01-17T03:29:59.999999872', '2003-01-17T04:30:00.000000000', '2003-01-17T05:30:00.000000128', '2003-01-17T06:29:59.999999872', '2003-01-17T07:30:00.000000000', '2003-01-17T08:30:00.000000128', '2003-01-17T09:29:59.999999872', '2003-01-17T10:30:00.000000000', '2003-01-17T11:30:00.000000128', '2003-01-17T12:29:59.999999872', '2003-01-17T13:30:00.000000000', '2003-01-17T14:30:00.000000128', '2003-01-17T15:29:59.999999872', '2003-01-17T16:30:00.000000000', '2003-01-17T17:30:00.000000128', '2003-01-17T18:29:59.999999872', '2003-01-17T19:30:00.000000000', '2003-01-17T20:30:00.000000128', '2003-01-17T21:29:59.999999872', '2003-01-17T22:30:00.000000000', '2003-01-17T23:30:00.000000128', '2003-01-18T00:29:59.999999872', '2003-01-18T01:30:00.000000000', '2003-01-18T02:30:00.000000128', '2003-01-18T03:29:59.999999872', '2003-01-18T04:30:00.000000000', '2003-01-18T05:30:00.000000128', '2003-01-18T06:29:59.999999872', '2003-01-18T07:30:00.000000000', '2003-01-18T08:30:00.000000128', '2003-01-18T09:29:59.999999872', '2003-01-18T10:30:00.000000000', '2003-01-18T11:30:00.000000128', '2003-01-18T12:29:59.999999872', '2003-01-18T13:30:00.000000000', '2003-01-18T14:30:00.000000128', '2003-01-18T15:29:59.999999872', '2003-01-18T16:30:00.000000000', '2003-01-18T17:30:00.000000128', '2003-01-18T18:29:59.999999872', '2003-01-18T19:30:00.000000000', '2003-01-18T20:30:00.000000128', '2003-01-18T21:29:59.999999872', '2003-01-18T22:30:00.000000000', '2003-01-18T23:30:00.000000128', '2003-01-19T00:29:59.999999872', '2003-01-19T01:30:00.000000000', '2003-01-19T02:30:00.000000128', '2003-01-19T03:29:59.999999872', '2003-01-19T04:30:00.000000000', '2003-01-19T05:30:00.000000128', '2003-01-19T06:29:59.999999872', '2003-01-19T07:30:00.000000000', '2003-01-19T08:30:00.000000128', '2003-01-19T09:29:59.999999872', '2003-01-19T10:30:00.000000000', '2003-01-19T11:30:00.000000128', '2003-01-19T12:29:59.999999872', '2003-01-19T13:30:00.000000000', '2003-01-19T14:30:00.000000128', '2003-01-19T15:29:59.999999872', '2003-01-19T16:30:00.000000000', '2003-01-19T17:30:00.000000128', '2003-01-19T18:29:59.999999872', '2003-01-19T19:30:00.000000000', '2003-01-19T20:30:00.000000128', '2003-01-19T21:29:59.999999872', '2003-01-19T22:30:00.000000000', '2003-01-19T23:30:00.000000128'], dtype='datetime64[ns]') - lat(lat)float64-48.79 -48.77 ... -6.852 -6.832
- bounds :
- lat_bnds
- units :
- degrees_north
- axis :
- Y
- long_name :
- Latitude
- standard_name :
- latitude
array([-48.787998, -48.7682 , -48.748398, ..., -6.871399, -6.851597, -6.831799]) - lon(lon)float64107.5 107.5 107.6 ... 159.0 159.0
- bounds :
- lon_bnds
- units :
- degrees_east
- axis :
- X
- long_name :
- Longitude
- standard_name :
- longitude
array([107.519997, 107.539795, 107.559593, ..., 158.940598, 158.960388, 158.980194]) - height()float64...
- units :
- m
- axis :
- Z
- positive :
- up
- long_name :
- height
- standard_name :
- height
[1 values with dtype=float64]
- time_bnds(time, bnds)datetime64[ns]dask.array<chunksize=(1, 2), meta=np.ndarray>
Array Chunk Bytes 1.50 kiB 16 B Shape (96, 2) (1, 2) Dask graph 96 chunks in 2 graph layers Data type datetime64[ns] numpy.ndarray - lat_bnds(lat, bnds)float64dask.array<chunksize=(2120, 2), meta=np.ndarray>
Array Chunk Bytes 33.12 kiB 33.12 kiB Shape (2120, 2) (2120, 2) Dask graph 1 chunks in 2 graph layers Data type float64 numpy.ndarray - lon_bnds(lon, bnds)float64dask.array<chunksize=(2600, 2), meta=np.ndarray>
Array Chunk Bytes 40.62 kiB 40.62 kiB Shape (2600, 2) (2600, 2) Dask graph 1 chunks in 2 graph layers Data type float64 numpy.ndarray - tas(time, lat, lon)float32dask.array<chunksize=(1, 1060, 1300), meta=np.ndarray>
- standard_name :
- air_temperature
- long_name :
- Near-Surface Air Temperature
- comment :
- near-surface (for access 1.5 meters) air temperature
- units :
- K
- cell_methods :
- area: mean time: mean
- cell_measures :
- area: areacella
- history :
- 2023-10-19T06:04:25Z altered by CMOR: Treated scalar dimension: 'height'. 2023-10-19T06:04:25Z altered by CMOR: replaced missing value flag (9.96921e+36) and corresponding data with standard missing value (1e+20).
Array Chunk Bytes 1.97 GiB 5.26 MiB Shape (96, 2120, 2600) (1, 1060, 1300) Dask graph 384 chunks in 2 graph layers Data type float32 numpy.ndarray
- timePandasIndex
PandasIndex(DatetimeIndex(['2003-01-16 00:29:59.999999872', '2003-01-16 01:30:00', '2003-01-16 02:30:00.000000128', '2003-01-16 03:29:59.999999872', '2003-01-16 04:30:00', '2003-01-16 05:30:00.000000128', '2003-01-16 06:29:59.999999872', '2003-01-16 07:30:00', '2003-01-16 08:30:00.000000128', '2003-01-16 09:29:59.999999872', '2003-01-16 10:30:00', '2003-01-16 11:30:00.000000128', '2003-01-16 12:29:59.999999872', '2003-01-16 13:30:00', '2003-01-16 14:30:00.000000128', '2003-01-16 15:29:59.999999872', '2003-01-16 16:30:00', '2003-01-16 17:30:00.000000128', '2003-01-16 18:29:59.999999872', '2003-01-16 19:30:00', '2003-01-16 20:30:00.000000128', '2003-01-16 21:29:59.999999872', '2003-01-16 22:30:00', '2003-01-16 23:30:00.000000128', '2003-01-17 00:29:59.999999872', '2003-01-17 01:30:00', '2003-01-17 02:30:00.000000128', '2003-01-17 03:29:59.999999872', '2003-01-17 04:30:00', '2003-01-17 05:30:00.000000128', '2003-01-17 06:29:59.999999872', '2003-01-17 07:30:00', '2003-01-17 08:30:00.000000128', '2003-01-17 09:29:59.999999872', '2003-01-17 10:30:00', '2003-01-17 11:30:00.000000128', '2003-01-17 12:29:59.999999872', '2003-01-17 13:30:00', '2003-01-17 14:30:00.000000128', '2003-01-17 15:29:59.999999872', '2003-01-17 16:30:00', '2003-01-17 17:30:00.000000128', '2003-01-17 18:29:59.999999872', '2003-01-17 19:30:00', '2003-01-17 20:30:00.000000128', '2003-01-17 21:29:59.999999872', '2003-01-17 22:30:00', '2003-01-17 23:30:00.000000128', '2003-01-18 00:29:59.999999872', '2003-01-18 01:30:00', '2003-01-18 02:30:00.000000128', '2003-01-18 03:29:59.999999872', '2003-01-18 04:30:00', '2003-01-18 05:30:00.000000128', '2003-01-18 06:29:59.999999872', '2003-01-18 07:30:00', '2003-01-18 08:30:00.000000128', '2003-01-18 09:29:59.999999872', '2003-01-18 10:30:00', '2003-01-18 11:30:00.000000128', '2003-01-18 12:29:59.999999872', '2003-01-18 13:30:00', '2003-01-18 14:30:00.000000128', '2003-01-18 15:29:59.999999872', '2003-01-18 16:30:00', '2003-01-18 17:30:00.000000128', '2003-01-18 18:29:59.999999872', '2003-01-18 19:30:00', '2003-01-18 20:30:00.000000128', '2003-01-18 21:29:59.999999872', '2003-01-18 22:30:00', '2003-01-18 23:30:00.000000128', '2003-01-19 00:29:59.999999872', '2003-01-19 01:30:00', '2003-01-19 02:30:00.000000128', '2003-01-19 03:29:59.999999872', '2003-01-19 04:30:00', '2003-01-19 05:30:00.000000128', '2003-01-19 06:29:59.999999872', '2003-01-19 07:30:00', '2003-01-19 08:30:00.000000128', '2003-01-19 09:29:59.999999872', '2003-01-19 10:30:00', '2003-01-19 11:30:00.000000128', '2003-01-19 12:29:59.999999872', '2003-01-19 13:30:00', '2003-01-19 14:30:00.000000128', '2003-01-19 15:29:59.999999872', '2003-01-19 16:30:00', '2003-01-19 17:30:00.000000128', '2003-01-19 18:29:59.999999872', '2003-01-19 19:30:00', '2003-01-19 20:30:00.000000128', '2003-01-19 21:29:59.999999872', '2003-01-19 22:30:00', '2003-01-19 23:30:00.000000128'], dtype='datetime64[ns]', name='time', freq=None)) - latPandasIndex
PandasIndex(Index([ -48.78799819946289, -48.7681999206543, -48.74839782714844, -48.728599548339844, -48.708797454833984, -48.68899917602539, -48.66919708251953, -48.64939880371094, -48.62959671020508, -48.609798431396484, ... -7.009998321533203, -6.990200042724609, -6.97039794921875, -6.950599670410156, -6.930797576904297, -6.910999298095703, -6.891197204589844, -6.87139892578125, -6.851596832275391, -6.831798553466797], dtype='float64', name='lat', length=2120)) - lonPandasIndex
PandasIndex(Index([ 107.5199966430664,   107.539794921875,  107.5595932006836,
       107.57939910888672, 107.59919738769531,  107.6189956665039,
        107.6387939453125, 107.65859985351562, 107.67839813232422,
       107.69819641113281,
       ...
         158.802001953125, 158.82179260253906,  158.8415985107422,
       158.86138916015625, 158.88119506835938,  158.9010009765625,
       158.92079162597656,  158.9405975341797, 158.96038818359375,
       158.98019409179688],
      dtype='float64', name='lon', length=2600))
- Conventions :
- CF-1.7 ACDD1.3
- contact :
- dsroberts@unimelb.edu.au
- contributor_email :
- paola.petrelli@utas.edu.au, sam.green@unsw.edu.au
- contributor_name :
- Paola Petrelli, Samuel Green
- contributor_role :
- data_curator, data_curator
- contributor_url :
- https://orcid.org/0000-0002-0164-5105, https://orcid.org/0000-0003-1129-4676
- creation_date :
- 2023-10-19T06:04:51Z
- creator_email :
- dsroberts@unimelb.edu.au
- creator_name :
- Dale Roberts
- creator_url :
- https://orcid.org/0000-0003-3952-6344
- data_specs_version :
- 01.00.00
- date_created :
- 2023-06-05
- exp_description :
- A limited area model study of the entire Australian continent at 2.2 km resolution, using the UM atmospheric model. ERA5+ERA5Land reanalysis data was used to provide initial and boundary conditions. The study covers the time period of 2003-01-16 to 2003-01-19, including the 2003 Canberra bushfires.
- experiment :
- canberra03
- experiment_id :
- canberra03
- external_variables :
- areacella
- forcing :
- GHG, Oz, SA, Sl, Vl, BC, OC, (GHG = CO2, N2O, CH4, CFC11, CFC12, CFC113, HCFC22, HFC125, HFC134a)
- frequency :
- 1hr
- further_info_url :
- https://furtherinfo.es-doc.org/.institution_idAUS2200.canberra03.sub_experiment_idvariant_label
- geospatial_lat_max :
- -6.83
- geospatial_lat_min :
- -48.79
- geospatial_lon_max :
- 158.98
- geospatial_lon_min :
- 107.52
- grid :
- native atmosphere grid (2120x2600 latxlon)
- history :
- 2023-10-19T06:04:51Z ; CMOR rewrote data to be consistent with , CF-1.7 ACDD1.3 and CF standards.
- institution :
- University of Melbourne
- keywords :
- Climate change processes, Adverse weather events, Cloud physics
- nominal_resolution :
- 2.2 km
- organisation :
- Centre of Excellence for Climate Extremes
- parent :
- False
- product :
- model-output
- product_version :
- v1.0
- realm :
- atmos
- source :
- UM v12.2 ECMWF ERA5 and ERA5-Land reanalysis fields used as forcings
- source_id :
- AUS2200
- table_id :
- A1hr
- table_info :
- Creation Date:(20 June 2023) MD5:71a4110ed3210ee3a5e9f7f71551dad2
- time_coverage_end :
- 2003-01-20
- time_coverage_start :
- 2003-01-16
- title :
- AUS2200 UM amip simulation of the 2003 Canberra bushfire.
- tracking_id :
- ddbb400b-b0a9-41f9-b88c-ecbccfeff5d3
- variable_id :
- tas
- version :
- v1.0
- license :
- https://creativecommons.org/licenses/by/4.0/
- cmor_version :
- 3.7.1
- intake_esm_vars :
- ['tas']
- intake_esm_attrs:path :
- /g/data/ua8/AUS2200/canberra03/v1-0/1hr/tas_AUS2200_canberra03_1hr_200301160030-200301192330.nc
- intake_esm_attrs:version :
- v1-0
- intake_esm_attrs:table :
- 1hr
- intake_esm_attrs:variable :
- tas
- intake_esm_attrs:experiment_id :
- canberra03
- intake_esm_attrs:frequency :
- 1hr
- intake_esm_attrs:date_range :
- 200301160030-200301192330
- intake_esm_attrs:_data_format_ :
- netcdf
- intake_esm_dataset_key :
- v1-0.1hr.tas
[7]:
tas = ds['tas']
tas
[7]:
<xarray.DataArray 'tas' (time: 96, lat: 2120, lon: 2600)> Size: 2GB
dask.array<open_dataset-tas, shape=(96, 2120, 2600), dtype=float32, chunksize=(1, 1060, 1300), chunktype=numpy.ndarray>
Coordinates:
  * time     (time) datetime64[ns] 768B 2003-01-16T00:29:59.999999872 ... 200...
  * lat      (lat) float64 17kB -48.79 -48.77 -48.75 ... -6.871 -6.852 -6.832
  * lon      (lon) float64 21kB 107.5 107.5 107.6 107.6 ... 158.9 159.0 159.0
    height   float64 8B ...
Attributes:
    standard_name:  air_temperature
    long_name:      Near-Surface Air Temperature
    comment:        near-surface (for access 1.5 meters) air temperature
    units:          K
    cell_methods:   area: mean time: mean
    cell_measures:  area: areacella
    history:        2023-10-19T06:04:25Z altered by CMOR: Treated scalar dime...
xarray.DataArray
'tas'
- time: 96
- lat: 2120
- lon: 2600
- dask.array<chunksize=(1, 1060, 1300), meta=np.ndarray>
Array Chunk Bytes 1.97 GiB 5.26 MiB Shape (96, 2120, 2600) (1, 1060, 1300) Dask graph 384 chunks in 2 graph layers Data type float32 numpy.ndarray - time(time)datetime64[ns]2003-01-16T00:29:59.999999872 .....
- bounds :
- time_bnds
- axis :
- T
- long_name :
- time
- standard_name :
- time
array(['2003-01-16T00:29:59.999999872', '2003-01-16T01:30:00.000000000', '2003-01-16T02:30:00.000000128', '2003-01-16T03:29:59.999999872', '2003-01-16T04:30:00.000000000', '2003-01-16T05:30:00.000000128', '2003-01-16T06:29:59.999999872', '2003-01-16T07:30:00.000000000', '2003-01-16T08:30:00.000000128', '2003-01-16T09:29:59.999999872', '2003-01-16T10:30:00.000000000', '2003-01-16T11:30:00.000000128', '2003-01-16T12:29:59.999999872', '2003-01-16T13:30:00.000000000', '2003-01-16T14:30:00.000000128', '2003-01-16T15:29:59.999999872', '2003-01-16T16:30:00.000000000', '2003-01-16T17:30:00.000000128', '2003-01-16T18:29:59.999999872', '2003-01-16T19:30:00.000000000', '2003-01-16T20:30:00.000000128', '2003-01-16T21:29:59.999999872', '2003-01-16T22:30:00.000000000', '2003-01-16T23:30:00.000000128', '2003-01-17T00:29:59.999999872', '2003-01-17T01:30:00.000000000', '2003-01-17T02:30:00.000000128', '2003-01-17T03:29:59.999999872', '2003-01-17T04:30:00.000000000', '2003-01-17T05:30:00.000000128', '2003-01-17T06:29:59.999999872', '2003-01-17T07:30:00.000000000', '2003-01-17T08:30:00.000000128', '2003-01-17T09:29:59.999999872', '2003-01-17T10:30:00.000000000', '2003-01-17T11:30:00.000000128', '2003-01-17T12:29:59.999999872', '2003-01-17T13:30:00.000000000', '2003-01-17T14:30:00.000000128', '2003-01-17T15:29:59.999999872', '2003-01-17T16:30:00.000000000', '2003-01-17T17:30:00.000000128', '2003-01-17T18:29:59.999999872', '2003-01-17T19:30:00.000000000', '2003-01-17T20:30:00.000000128', '2003-01-17T21:29:59.999999872', '2003-01-17T22:30:00.000000000', '2003-01-17T23:30:00.000000128', '2003-01-18T00:29:59.999999872', '2003-01-18T01:30:00.000000000', '2003-01-18T02:30:00.000000128', '2003-01-18T03:29:59.999999872', '2003-01-18T04:30:00.000000000', '2003-01-18T05:30:00.000000128', '2003-01-18T06:29:59.999999872', '2003-01-18T07:30:00.000000000', '2003-01-18T08:30:00.000000128', '2003-01-18T09:29:59.999999872', '2003-01-18T10:30:00.000000000', '2003-01-18T11:30:00.000000128', '2003-01-18T12:29:59.999999872', '2003-01-18T13:30:00.000000000', '2003-01-18T14:30:00.000000128', '2003-01-18T15:29:59.999999872', '2003-01-18T16:30:00.000000000', '2003-01-18T17:30:00.000000128', '2003-01-18T18:29:59.999999872', '2003-01-18T19:30:00.000000000', '2003-01-18T20:30:00.000000128', '2003-01-18T21:29:59.999999872', '2003-01-18T22:30:00.000000000', '2003-01-18T23:30:00.000000128', '2003-01-19T00:29:59.999999872', '2003-01-19T01:30:00.000000000', '2003-01-19T02:30:00.000000128', '2003-01-19T03:29:59.999999872', '2003-01-19T04:30:00.000000000', '2003-01-19T05:30:00.000000128', '2003-01-19T06:29:59.999999872', '2003-01-19T07:30:00.000000000', '2003-01-19T08:30:00.000000128', '2003-01-19T09:29:59.999999872', '2003-01-19T10:30:00.000000000', '2003-01-19T11:30:00.000000128', '2003-01-19T12:29:59.999999872', '2003-01-19T13:30:00.000000000', '2003-01-19T14:30:00.000000128', '2003-01-19T15:29:59.999999872', '2003-01-19T16:30:00.000000000', '2003-01-19T17:30:00.000000128', '2003-01-19T18:29:59.999999872', '2003-01-19T19:30:00.000000000', '2003-01-19T20:30:00.000000128', '2003-01-19T21:29:59.999999872', '2003-01-19T22:30:00.000000000', '2003-01-19T23:30:00.000000128'], dtype='datetime64[ns]') - lat(lat)float64-48.79 -48.77 ... -6.852 -6.832
- bounds :
- lat_bnds
- units :
- degrees_north
- axis :
- Y
- long_name :
- Latitude
- standard_name :
- latitude
array([-48.787998, -48.7682 , -48.748398, ..., -6.871399, -6.851597, -6.831799]) - lon(lon)float64107.5 107.5 107.6 ... 159.0 159.0
- bounds :
- lon_bnds
- units :
- degrees_east
- axis :
- X
- long_name :
- Longitude
- standard_name :
- longitude
array([107.519997, 107.539795, 107.559593, ..., 158.940598, 158.960388, 158.980194]) - height()float64...
- units :
- m
- axis :
- Z
- positive :
- up
- long_name :
- height
- standard_name :
- height
[1 values with dtype=float64]
- timePandasIndex
PandasIndex(DatetimeIndex(['2003-01-16 00:29:59.999999872', '2003-01-16 01:30:00', '2003-01-16 02:30:00.000000128', '2003-01-16 03:29:59.999999872', '2003-01-16 04:30:00', '2003-01-16 05:30:00.000000128', '2003-01-16 06:29:59.999999872', '2003-01-16 07:30:00', '2003-01-16 08:30:00.000000128', '2003-01-16 09:29:59.999999872', '2003-01-16 10:30:00', '2003-01-16 11:30:00.000000128', '2003-01-16 12:29:59.999999872', '2003-01-16 13:30:00', '2003-01-16 14:30:00.000000128', '2003-01-16 15:29:59.999999872', '2003-01-16 16:30:00', '2003-01-16 17:30:00.000000128', '2003-01-16 18:29:59.999999872', '2003-01-16 19:30:00', '2003-01-16 20:30:00.000000128', '2003-01-16 21:29:59.999999872', '2003-01-16 22:30:00', '2003-01-16 23:30:00.000000128', '2003-01-17 00:29:59.999999872', '2003-01-17 01:30:00', '2003-01-17 02:30:00.000000128', '2003-01-17 03:29:59.999999872', '2003-01-17 04:30:00', '2003-01-17 05:30:00.000000128', '2003-01-17 06:29:59.999999872', '2003-01-17 07:30:00', '2003-01-17 08:30:00.000000128', '2003-01-17 09:29:59.999999872', '2003-01-17 10:30:00', '2003-01-17 11:30:00.000000128', '2003-01-17 12:29:59.999999872', '2003-01-17 13:30:00', '2003-01-17 14:30:00.000000128', '2003-01-17 15:29:59.999999872', '2003-01-17 16:30:00', '2003-01-17 17:30:00.000000128', '2003-01-17 18:29:59.999999872', '2003-01-17 19:30:00', '2003-01-17 20:30:00.000000128', '2003-01-17 21:29:59.999999872', '2003-01-17 22:30:00', '2003-01-17 23:30:00.000000128', '2003-01-18 00:29:59.999999872', '2003-01-18 01:30:00', '2003-01-18 02:30:00.000000128', '2003-01-18 03:29:59.999999872', '2003-01-18 04:30:00', '2003-01-18 05:30:00.000000128', '2003-01-18 06:29:59.999999872', '2003-01-18 07:30:00', '2003-01-18 08:30:00.000000128', '2003-01-18 09:29:59.999999872', '2003-01-18 10:30:00', '2003-01-18 11:30:00.000000128', '2003-01-18 12:29:59.999999872', '2003-01-18 13:30:00', '2003-01-18 14:30:00.000000128', '2003-01-18 15:29:59.999999872', '2003-01-18 16:30:00', '2003-01-18 17:30:00.000000128', '2003-01-18 18:29:59.999999872', '2003-01-18 19:30:00', '2003-01-18 20:30:00.000000128', '2003-01-18 21:29:59.999999872', '2003-01-18 22:30:00', '2003-01-18 23:30:00.000000128', '2003-01-19 00:29:59.999999872', '2003-01-19 01:30:00', '2003-01-19 02:30:00.000000128', '2003-01-19 03:29:59.999999872', '2003-01-19 04:30:00', '2003-01-19 05:30:00.000000128', '2003-01-19 06:29:59.999999872', '2003-01-19 07:30:00', '2003-01-19 08:30:00.000000128', '2003-01-19 09:29:59.999999872', '2003-01-19 10:30:00', '2003-01-19 11:30:00.000000128', '2003-01-19 12:29:59.999999872', '2003-01-19 13:30:00', '2003-01-19 14:30:00.000000128', '2003-01-19 15:29:59.999999872', '2003-01-19 16:30:00', '2003-01-19 17:30:00.000000128', '2003-01-19 18:29:59.999999872', '2003-01-19 19:30:00', '2003-01-19 20:30:00.000000128', '2003-01-19 21:29:59.999999872', '2003-01-19 22:30:00', '2003-01-19 23:30:00.000000128'], dtype='datetime64[ns]', name='time', freq=None)) - latPandasIndex
PandasIndex(Index([ -48.78799819946289, -48.7681999206543, -48.74839782714844, -48.728599548339844, -48.708797454833984, -48.68899917602539, -48.66919708251953, -48.64939880371094, -48.62959671020508, -48.609798431396484, ... -7.009998321533203, -6.990200042724609, -6.97039794921875, -6.950599670410156, -6.930797576904297, -6.910999298095703, -6.891197204589844, -6.87139892578125, -6.851596832275391, -6.831798553466797], dtype='float64', name='lat', length=2120)) - lonPandasIndex
PandasIndex(Index([ 107.5199966430664,   107.539794921875,  107.5595932006836,
       107.57939910888672, 107.59919738769531,  107.6189956665039,
        107.6387939453125, 107.65859985351562, 107.67839813232422,
       107.69819641113281,
       ...
         158.802001953125, 158.82179260253906,  158.8415985107422,
       158.86138916015625, 158.88119506835938,  158.9010009765625,
       158.92079162597656,  158.9405975341797, 158.96038818359375,
       158.98019409179688],
      dtype='float64', name='lon', length=2600))
- standard_name :
- air_temperature
- long_name :
- Near-Surface Air Temperature
- comment :
- near-surface (for access 1.5 meters) air temperature
- units :
- K
- cell_methods :
- area: mean time: mean
- cell_measures :
- area: areacella
- history :
- 2023-10-19T06:04:25Z altered by CMOR: Treated scalar dimension: 'height'. 2023-10-19T06:04:25Z altered by CMOR: replaced missing value flag (9.96921e+36) and corresponding data with standard missing value (1e+20).
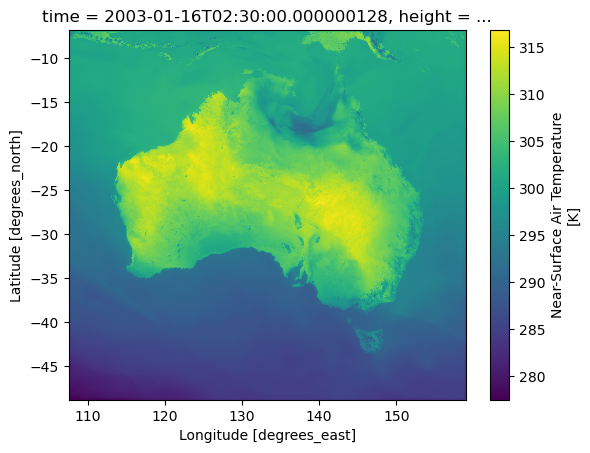
[8]:
tas.cf.sel(time = '2003-01-16T02:30:00').plot()
[8]:
<matplotlib.collections.QuadMesh at 0x1515d0d2d9c0>
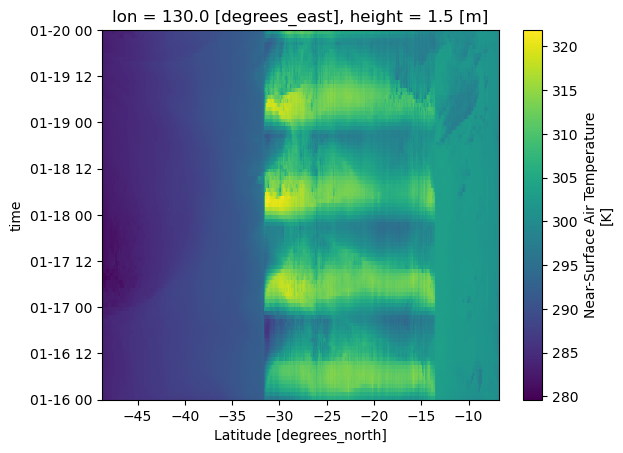
Plot a Hovmoller
[9]:
tas.cf.sel(longitude = 130, method='nearest').plot()
[9]:
<matplotlib.collections.QuadMesh at 0x1515a82d13f0>